Plugin dashboard
This is the default landing page after successfully authenticate.
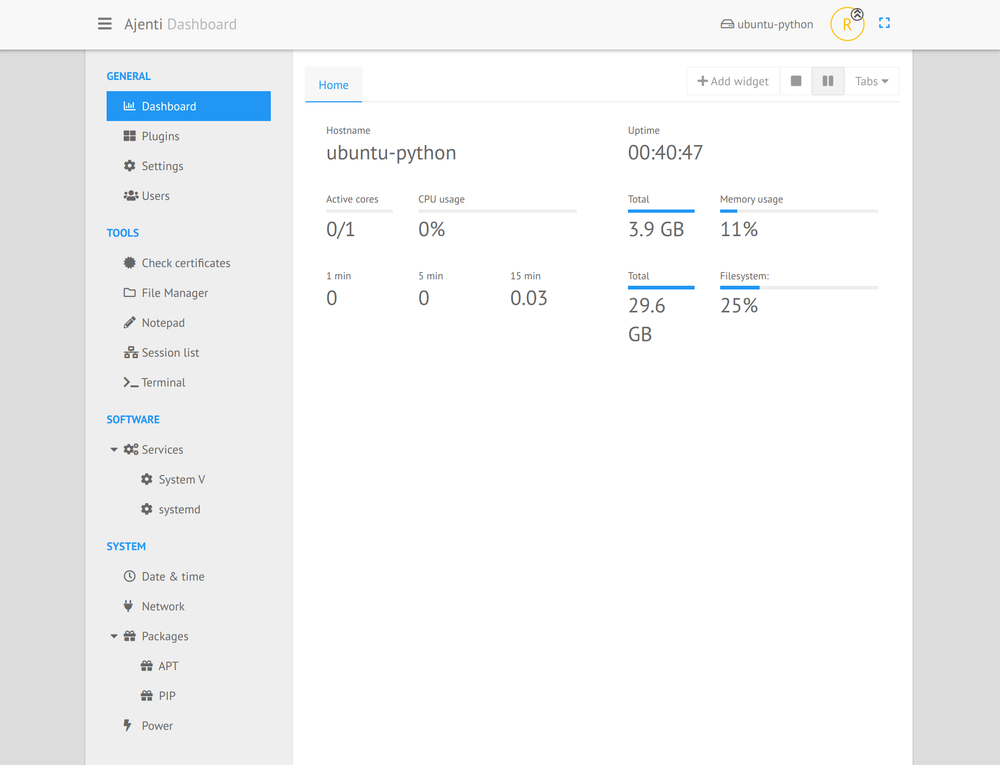
It’s possible to display the widgets of your choice, and to order them as you want with a simple drag&drop.
You can also add other tabs, and rename them the way you want.
The list of actual available widgets:
- Check certificates,
- CPU Usage,
- Disk space (you can choose the mount point),
- Hostname,
- Load average,
- Memory usage,
- Power state,
- Script (run your own command),
- Service (status of a service in systemd or sysv init),
- Sessions (logged in users),
- Traffic,
- Uptime.